



· Yogesh Khedar· Operations· 5 min read
Detecting Component Failure — Manage Your Fleet or Regret It
Failure rarely arrives unannounced. Vibration trends, current creep and link decay all show up in the data before the crash — if anyone is looking.
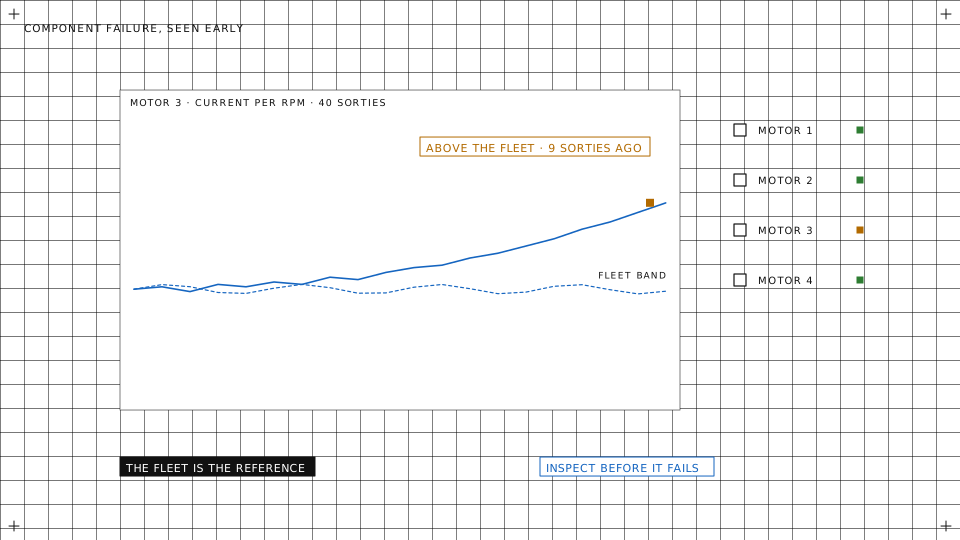
Component failure rarely arrives unannounced. Almost every crash report we have seen had precursors sitting in the logs for weeks, visible to anyone who looked, seen by no one. Manage the fleet, or regret it.
What degradation looks like
Each component announces itself in its own signal. These are the ones that recur.
- Motors and ESCs. At the same hover, one motor draws more current than the other three, or needs more output to hold the same rpm. The spread between motors grows week by week. A bearing announces itself in the vibration spectrum long before it seizes, and an ESC that is running hot shows up as current that rises faster than rpm.
- Propellers. A nicked or imbalanced prop shifts the vibration signature within a single flight. Cheap to replace, expensive to ignore, and the easiest fault to confirm: swap the prop and watch the number fall.
- Battery packs. Voltage sag at the take-off step grows as internal resistance rises, well before capacity fade is noticeable. The spread between cells widens. A pack that reports a cycle count past its limit, or is flown after it was retired, is a finding in itself.
- IMU and compass. The estimator’s own confidence tells the story: a rising EKF variance, the compass disagreeing with the current draw, two IMUs drifting apart. These precede the flyaway everyone later blames on interference.
- Radios and modems. An ageing LTE modem drops link quality gradually. Signal strength and error counts trend the wrong way for weeks before the day it will not connect.
- The companion computer. CPU temperature creeping up, free memory creeping down, a storage volume filling. Not a flight-safety fault today, a missing log tomorrow.
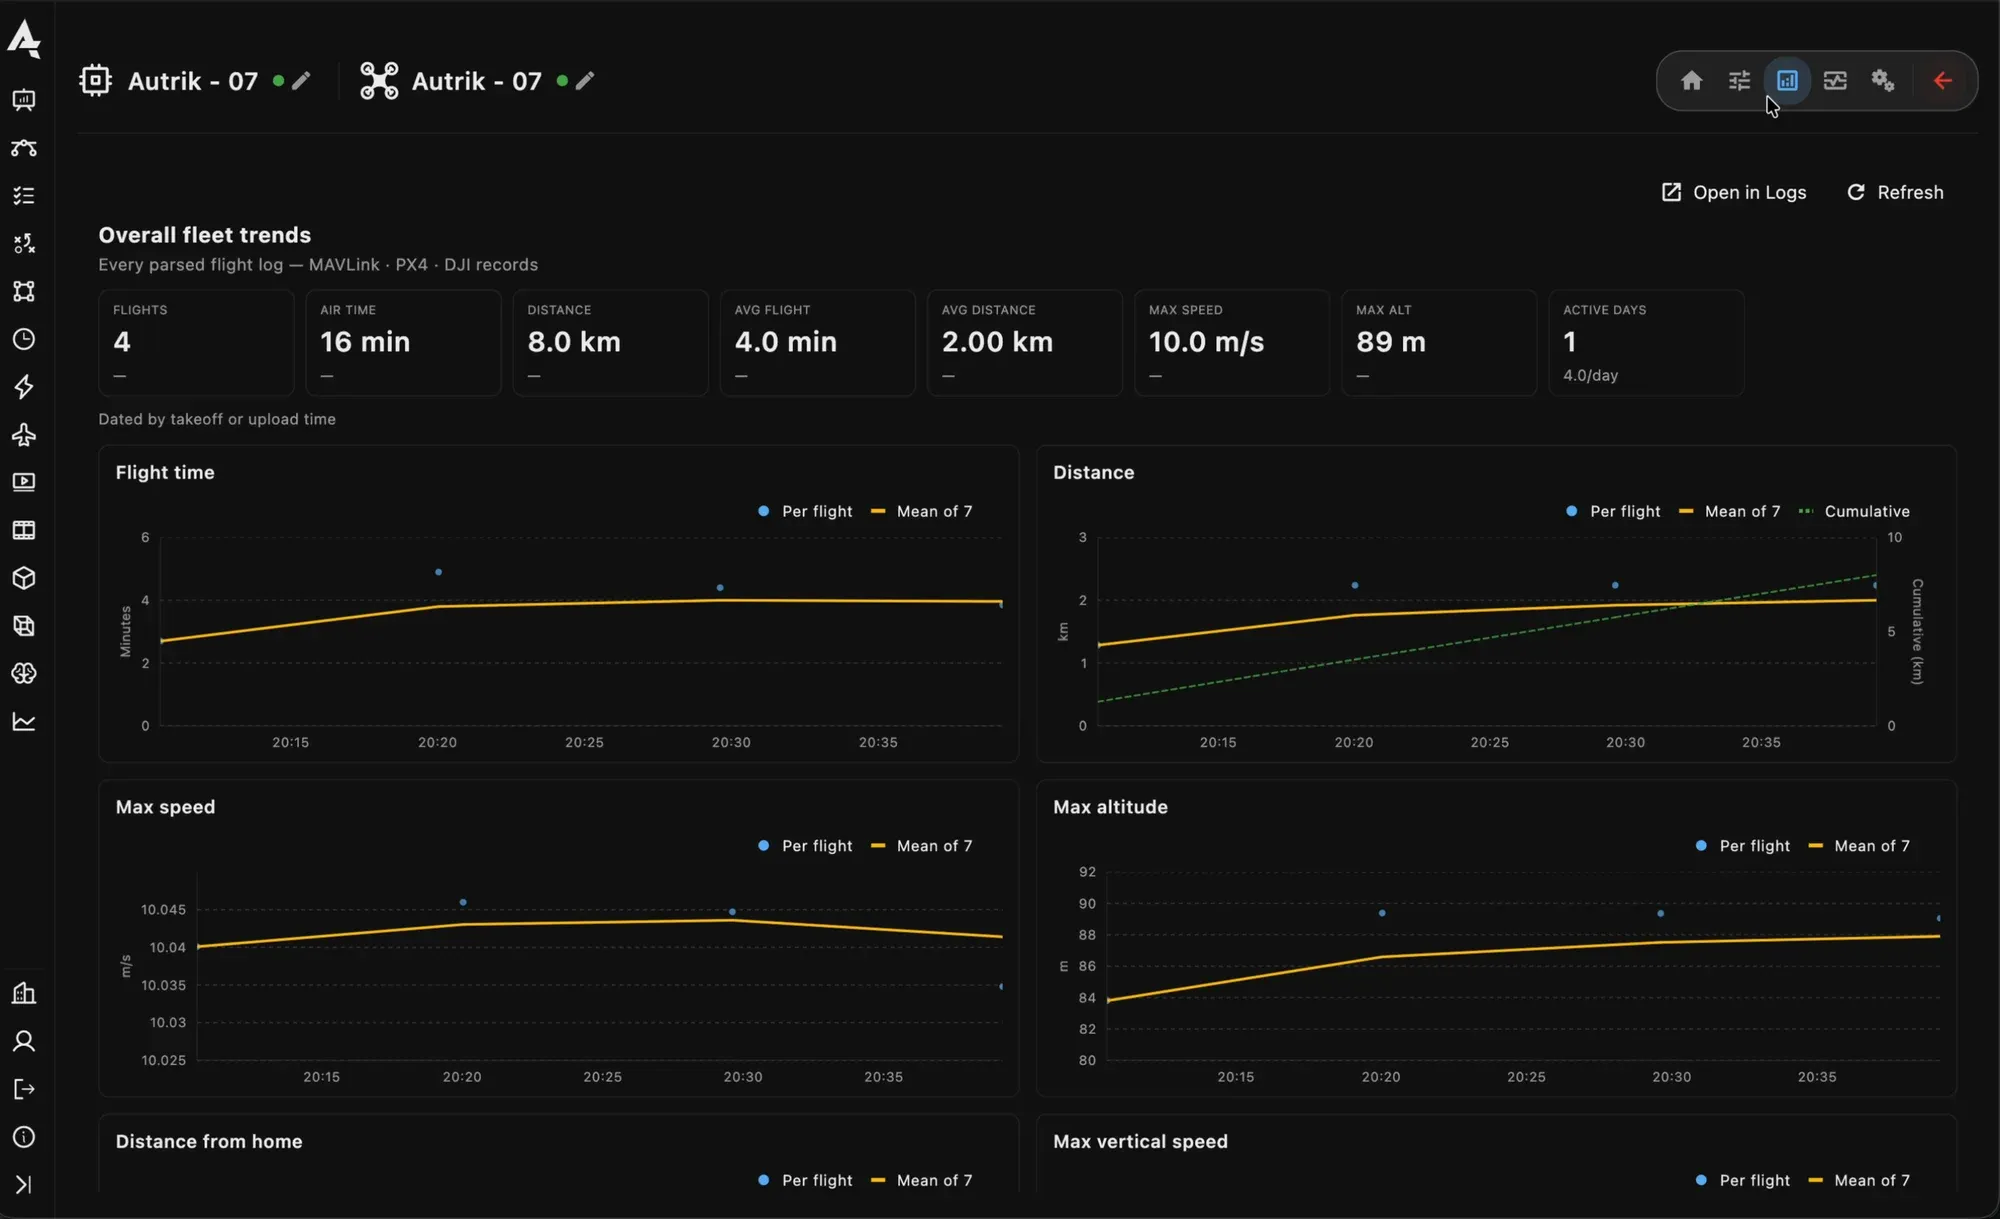
One device’s trends: flight time, distance, speed, altitude and battery per flight, with the mean of the last seven.
The fleet is the reference
The single most effective trick needs no machine learning: compare each component against its own history, and each aircraft against its siblings.
Absolute thresholds are hard to set and easy to argue with. A motor’s current per rpm depends on the airframe, the propeller and the air that day. But the same motor’s value against its own last forty sorties, with the median and the spread as the baseline, needs no agreed limit to look wrong. Where the autopilot’s maker does publish a limit, vibration levels, estimator trust, supply ripple, cell spread, that limit judges first and is drawn on the chart.
This is how the health twin in AutrikOS works. Every flight’s log leaves the aircraft by itself and is reduced to a few dozen figures per component: vibration percentiles, motor output and current spreads in hover, pack sag and internal resistance at take-off, cell spread, estimator variance, link quality, the companion’s load. Every night the fleet is re-judged: each figure against its own rolling baseline and the published limits, a trend fitted, and a due date put on each one heading for a limit. The result is a state per component, nominal, watch, inspect or ground, with the numbers underneath for the person who needs them.
Three worked examples
The motor that worked harder. A quadcopter in a test fleet showed motor 3’s current per rpm two percent above its siblings. Within limits, unremarkable on any single flight. Over thirty sorties the gap grew to eight percent while the other three stayed flat. The bearing was replaced on a due date instead of on the ground.
The pack that sagged. A pack’s take-off sag grew by a tenth of a volt over two months while its reported capacity barely moved. Internal resistance had risen. The pack was retired at the cycle limit the workspace had set, and the register shows who retired it and why.
The compass that was not interference. An aircraft that twice lost heading on the same site was assumed to be suffering from the site. Its logs showed the compass disagreeing with the current draw on every flight, everywhere, a little more each week. The compass was the fault; the site was a coincidence.
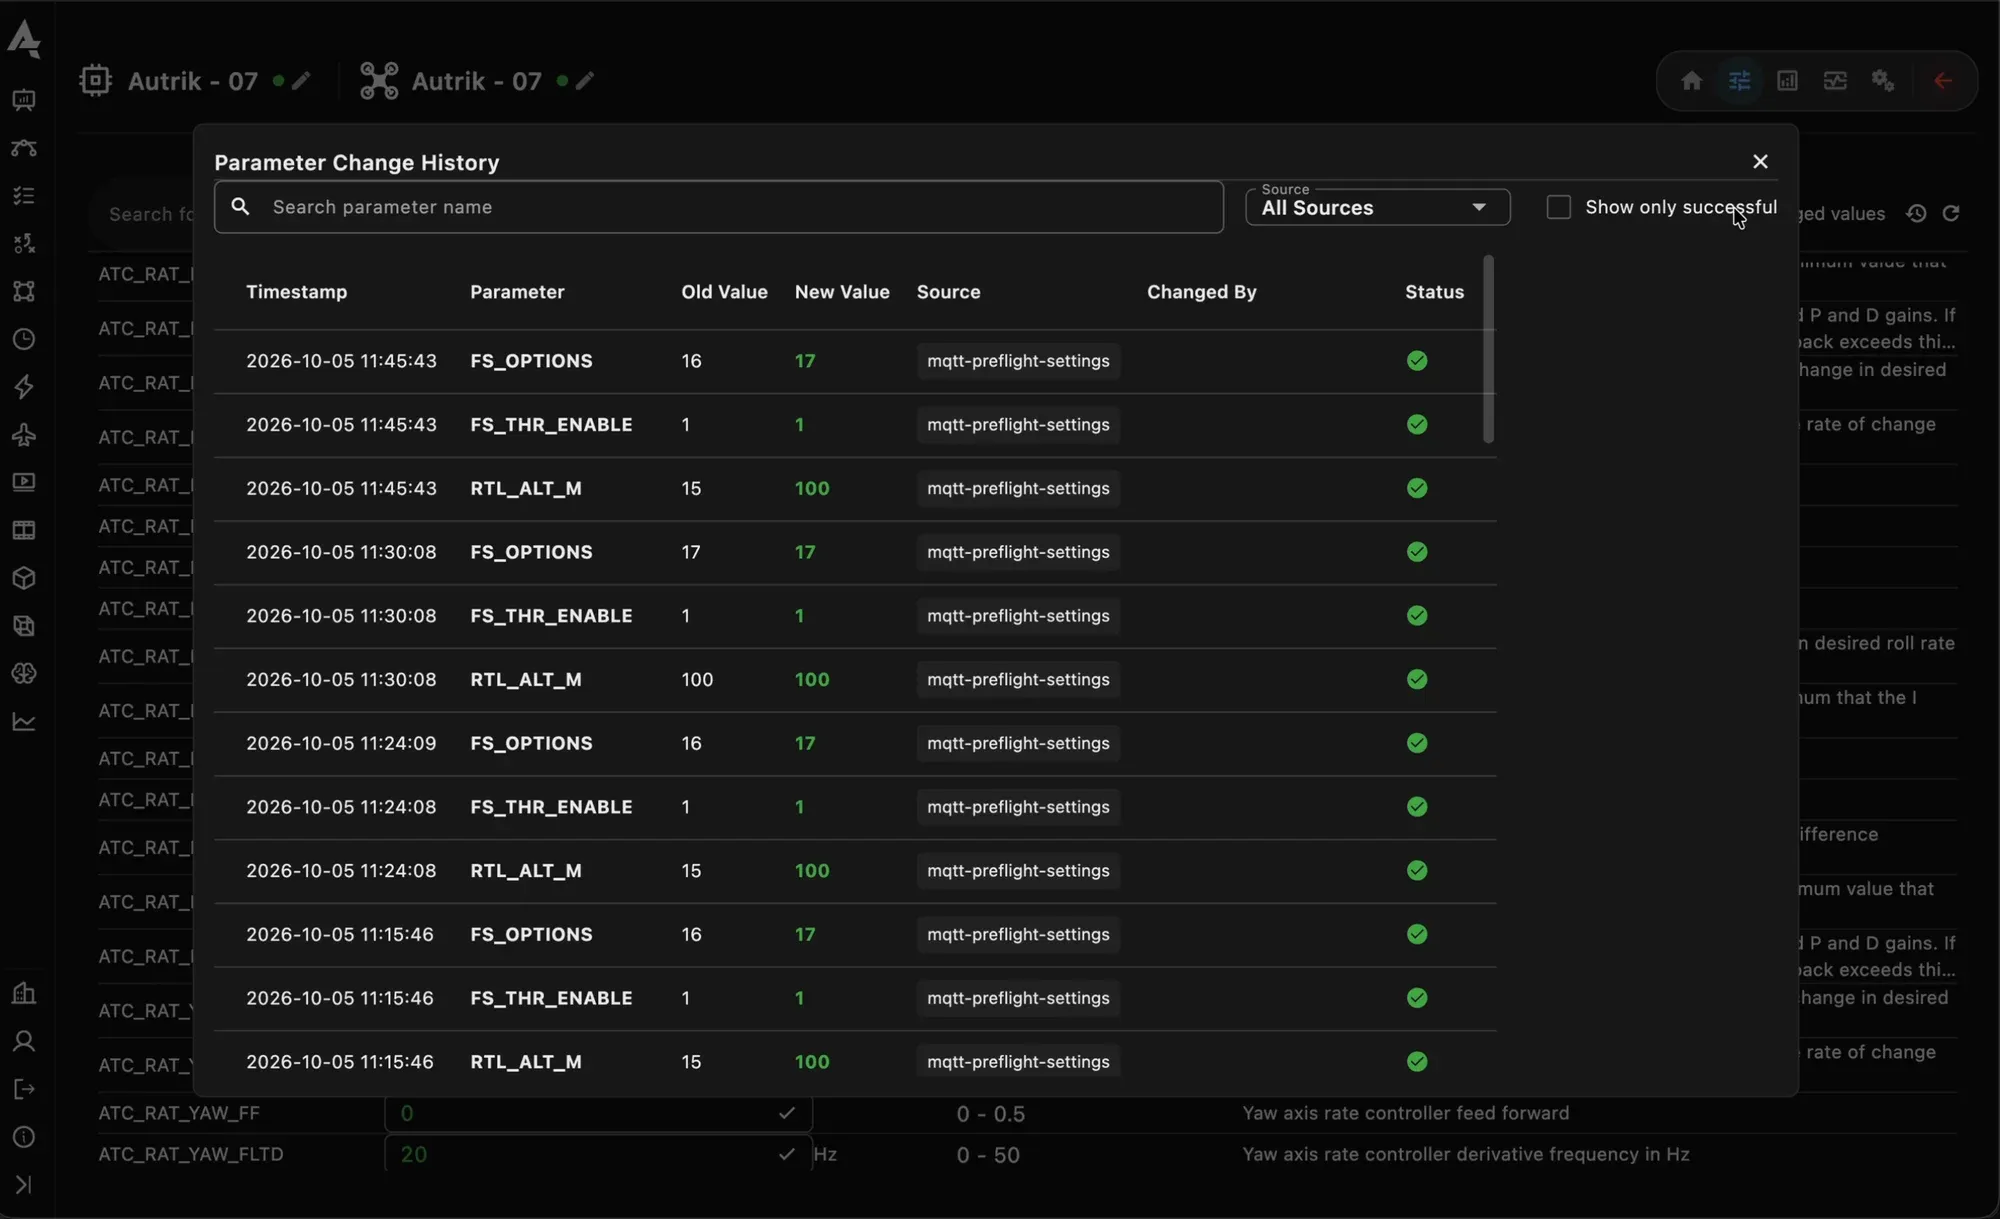
The parameter change history of one aircraft: what changed, when, and who changed it.
From detection to action
Detection only pays when it triggers something. In the console a warning stays open until an admin resolves it, with the flight it came from replayable. The due list says what is due on each device and when. The maintenance record and the tech log, as a PDF, carry the evidence, which is also what a warranty claim needs: not “it felt wrong”, but forty sorties of a number heading for a line.
Close that loop and the fleet gets more reliable every month it flies.
The deeper practice behind this is in Failure Analysis: What Drone Teams Can Learn from Space Programmes. The feature itself is on the Fleet Health page.